Weather Alert in Wisconsin
Air Quality Alert issued August 11 at 8:36AM CDT by NWS La Crosse WI
AREAS AFFECTED: Taylor; Clark; Buffalo; Trempealeau; Jackson; La Crosse; Monroe; Juneau; Adams; Vernon
DESCRIPTION: The Wisconsin Department of Natural Resources has issued an Air Quality Advisory for the following counties: Adams, Buffalo, Clark, Jackson, Juneau, La Crosse, Monroe, Taylor, Trempealeau, and Vernon. WHAT...The PM2.5 AQI is expected to reach the Unhealthy for Sensitive Groups (Orange) to Unhealthy (Red) level. WHERE...West-central Wisconsin. WHEN...From 10 AM Monday until 3 PM Tuesday. Precautionary/Preparedness Actions: Sensitive groups: Make outdoor activities shorter and less intense. It is OK to be active outdoors but take more breaks. Watch for symptoms such as coughing or shortness of breath. People with asthma: Follow your asthma action plan and keep quick relief medicine handy. People with heart disease: Symptoms such as palpitations, shortness of breath, or unusual fatigue may indicate a serious problem. If you have any of these, contact your health care provider. Additional Details: Canadian wildfire smoke will impact surface air quality as it moves ENE across northern portions of the state later Monday morning through early Tuesday afternoon. The heaviest smoke impacts are expected in far northwest Wisconsin, where PM2.5 NowCast AQI values of Unhealthy (Red) will be possible. Lesser impacts in the Moderate (Yellow) to Unhealthy for Sensitive Groups (Orange) AQI range are expected further south and east in the advisory area. A cold front moving in from the northwest on Tuesday morning will begin to clear this initial round of smoke from northwest to southeast. Although more smoke could move in behind the front, we do not expect advisory criteria to be met with the second round of smoke at this time. For more information on current air quality, please see: https://airquality.wi.gov
INSTRUCTION: N/A
Want more detail? Get the Complete 7 Day and Night Detailed Forecast!
Current U.S. National Radar--Current
The Current National Weather Radar is shown below with a UTC Time (subtract 5 hours from UTC to get Eastern Time).

National Weather Forecast--Current
The Current National Weather Forecast and National Weather Map are shown below.

National Weather Forecast for Tomorrow
Tomorrow National Weather Forecast and Tomorrow National Weather Map are show below.

North America Water Vapor (Moisture)
This map shows recent moisture content over North America. Bright and colored areas show high moisture (ie, clouds); brown indicates very little moisture present; black indicates no moisture.

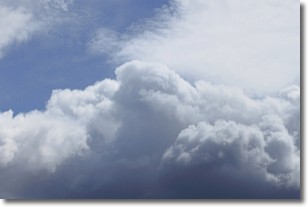
Weather Topic: What are Nimbostratus Clouds?
Home - Education - Cloud Types - Nimbostratus Clouds
 Next Topic: Precipitation
A nimbostratus cloud is similar to a stratus cloud in its formless,
smooth appearance. However, a nimbostratus cloud is darker than a stratus cloud,
because it is thicker.
Unlike a stratus cloud, a nimbostratus cloud typically brings with it the threat
of moderate to heavy precipitation. In some cases, the precipitation may evaporate
before reaching the ground, a phenomenon known as virga.
Next Topic: Precipitation
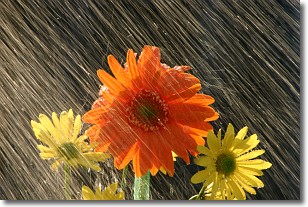
Weather Topic: What is Rain?
Home - Education - Precipitation - Rain
 Next Topic: Shelf Clouds
Precipitation in the form of water droplets is called rain.
Rain generally has a tendency to fall with less intensity over a greater period
of time, and when rainfall is more severe it is usually less sustained.
Rain is the most common form of precipitation and happens with greater frequency
depending on the season and regional influences. Cities have been shown to have
an observable effect on rainfall, due to an effect called the urban heat island.
Compared to upwind, monthly rainfall between twenty and forty miles downwind of
cities is 30% greater.
Next Topic: Shelf Clouds
Current conditions powered by WeatherAPI.com